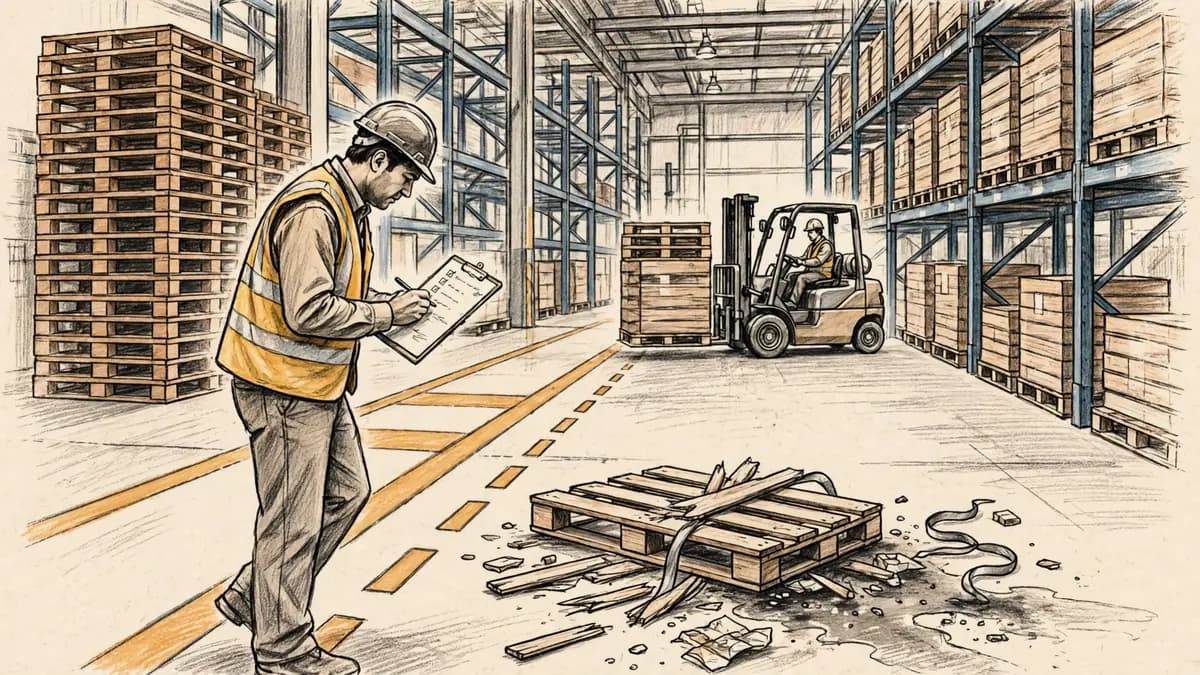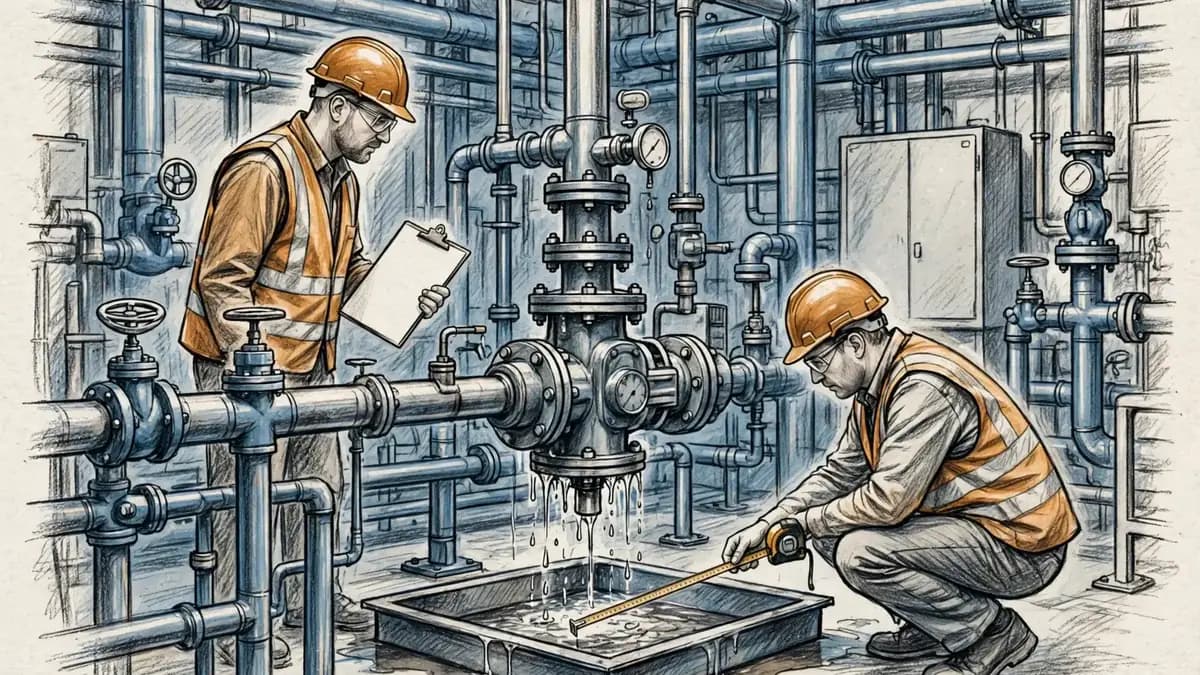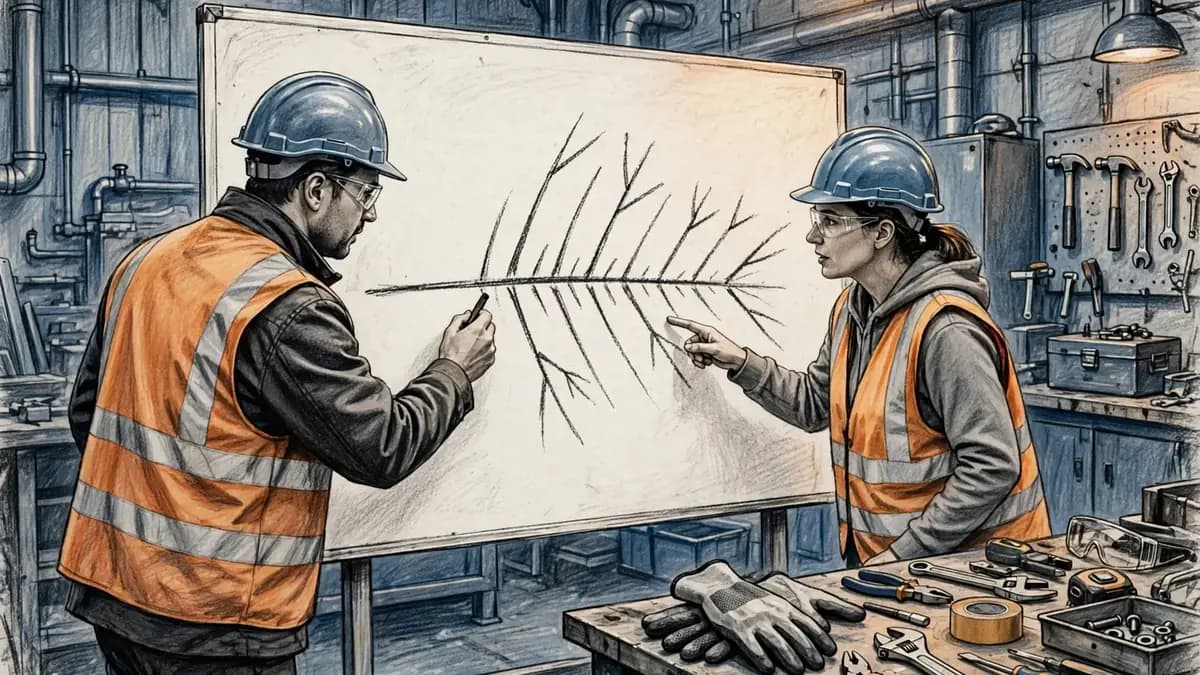
A fishbone diagram is a visual tool that traces one problem back to its possible causes. The problem sits at the head of the fish, on the right of the page. Lines branch off a central spine for each major category of causes, and smaller lines branch off those for subcauses.
The method suits incidents, near misses and problems that keep coming back after a fix. It forces a team to look past the first explanation, map every plausible cause, and test each one against evidence before choosing what to change. The sections below explain what the diagram is, when to use it, how to build one in seven steps, and how a safety team used it on a knife cut.
What is a fishbone diagram?
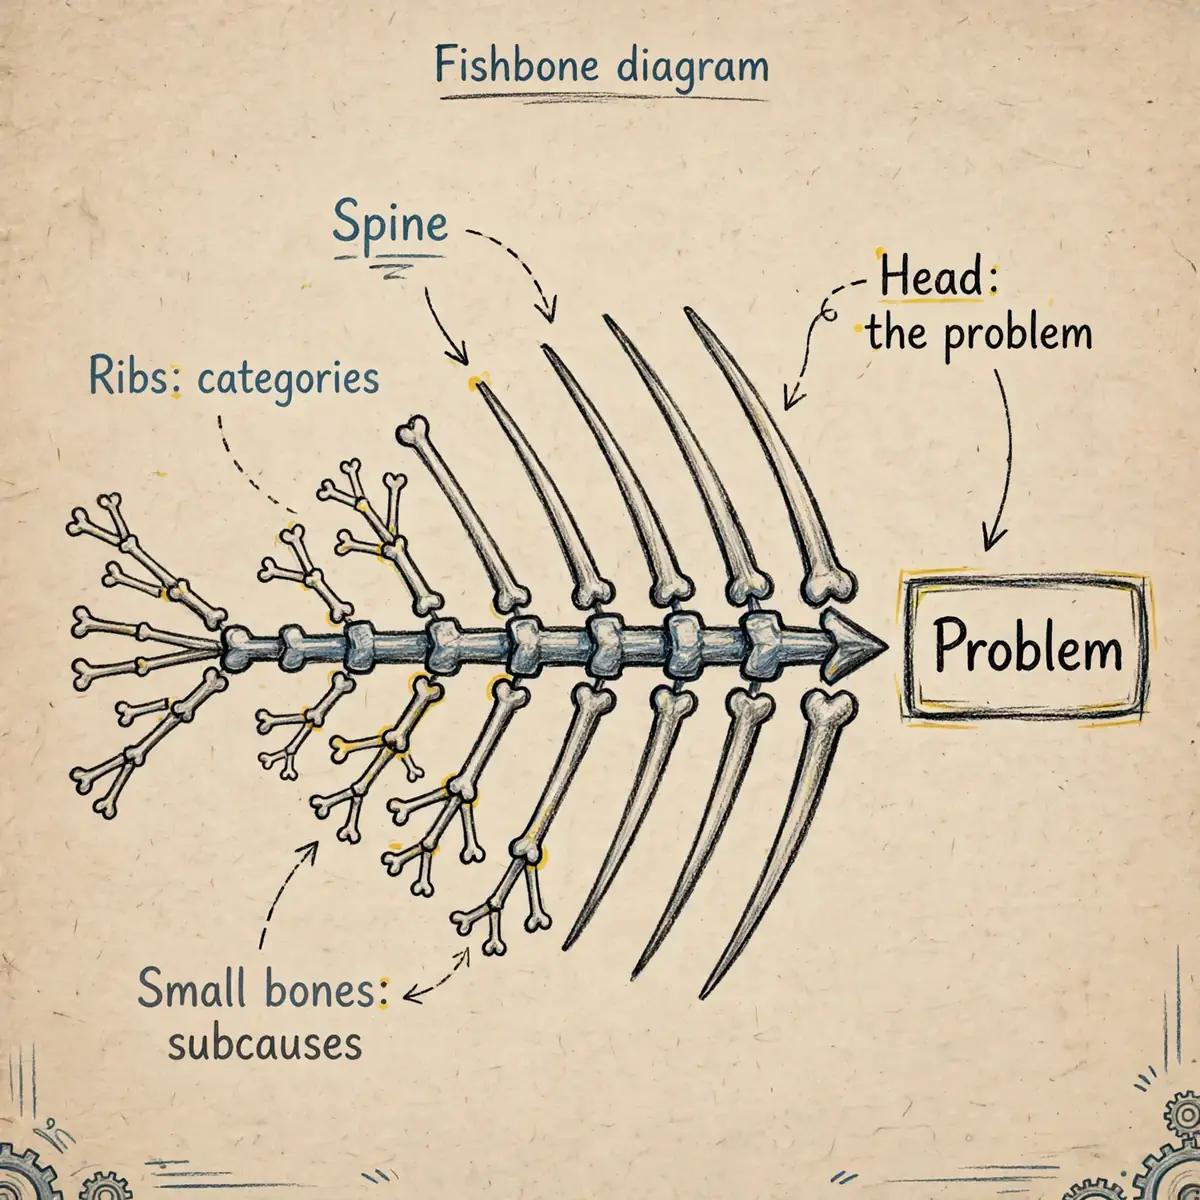
A fishbone diagram is also called an Ishikawa diagram, after its creator, the Japanese quality expert Kaoru Ishikawa, or a cause-and-effect diagram. Ishikawa developed it in the 1960s, and it is now counted among the Seven Basic Quality Tools. The American Society for Quality (ASQ) describes it as a tool that sorts possible causes into useful categories and structures brainstorming sessions.
The shape gives the tool its name. A completed diagram looks like a fish skeleton: a horizontal spine runs across the page, ribs branch off it for the major categories, and smaller bones branch off the ribs for subcauses. The problem statement sits in a box at the head, on the right.
A fishbone diagram differs from a mind map in one important way. A mind map explores a topic in any direction. A fishbone diagram has one job: trace a single problem back to its root causes in a structured way. That focus is what makes it useful after an incident, when opinions are many and evidence is thin.
ASQ also lists variations on the basic form: a cause-enumeration diagram, a process fishbone that follows the steps of a process, a cause-and-effect diagram with the addition of cards (CEDAC), a desired-result fishbone and a reverse fishbone. The basic form covered here suits most safety work; the variations suit specialist quality projects.
The diagram does not prove a cause, and it does not fix anything by itself. It organises hypotheses so a team can test them one by one. A cause that survives testing becomes a candidate for a corrective action; a cause with no evidence behind it is crossed out.
TipDraw the diagram large enough for the whole team to see it. A fishbone built on a small sheet of paper runs out of room before the causes run out.
When to use a fishbone diagram
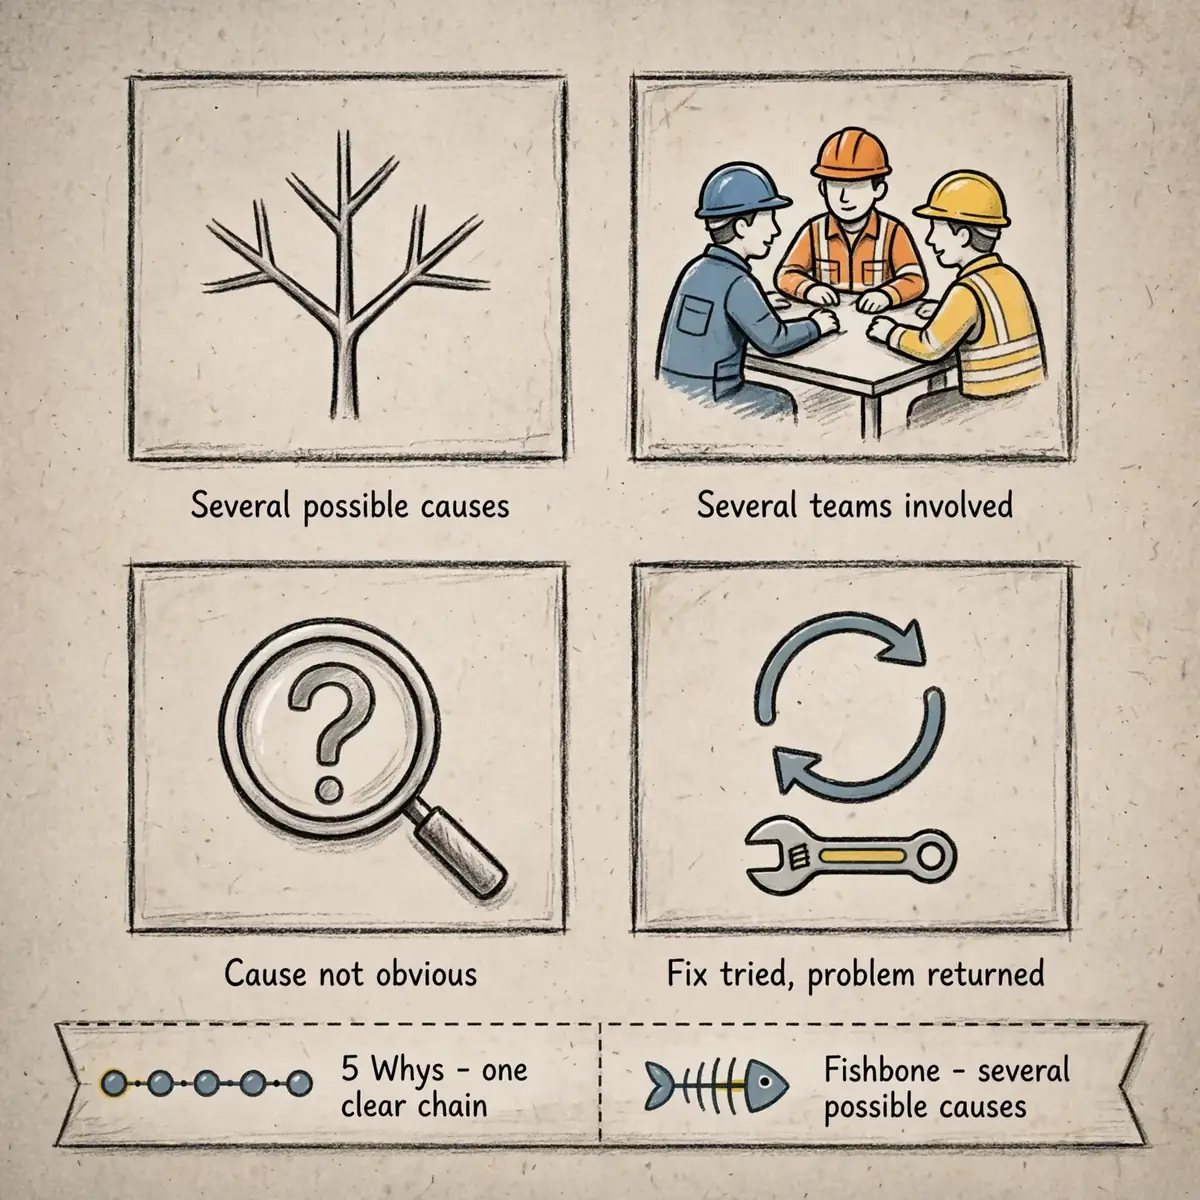
Use a fishbone diagram when a problem has several possible causes, when several departments or teams are involved, when the cause is not obvious, or when a fix has already been tried and the problem came back. A single clear chain of events does not need one.
For a simple problem, the 5 Whys alone may be enough: ask why five times and follow the chain to a correctable cause. When the chain branches — when training, equipment, procedures and supervision could all have played a part — a fishbone diagram holds all the branches in view at once. The two tools are often used together: the diagram maps the branches, and the 5 Whys digs down each one.
Fishbone diagrams sit inside root cause analysis, the broader discipline of finding the underlying reason a problem happened. The table below compares the common methods, so a team can pick the right one for the problem in front of it.
| Method | Best for | Effort | What it produces |
|---|---|---|---|
| 5 Whys | Simple problems with one clear chain | Low | A chain of causes down to one root cause |
| Fishbone diagram | Problems with several possible causes | Medium | A map of causes by category, tested against evidence |
| Pareto analysis | Choosing which problem to tackle first | Medium | Causes ranked by frequency or impact |
| Fault tree analysis | Safety-critical failures | High | A logic tree of failure combinations |
A fishbone diagram also fits problems that are not incidents at all: repeated defects, missed deadlines, rising near-miss counts, or a procedure nobody follows. The same structure applies. The head holds the effect, the ribs hold the categories, and the evidence decides which causes survive.
The anatomy of a fishbone diagram
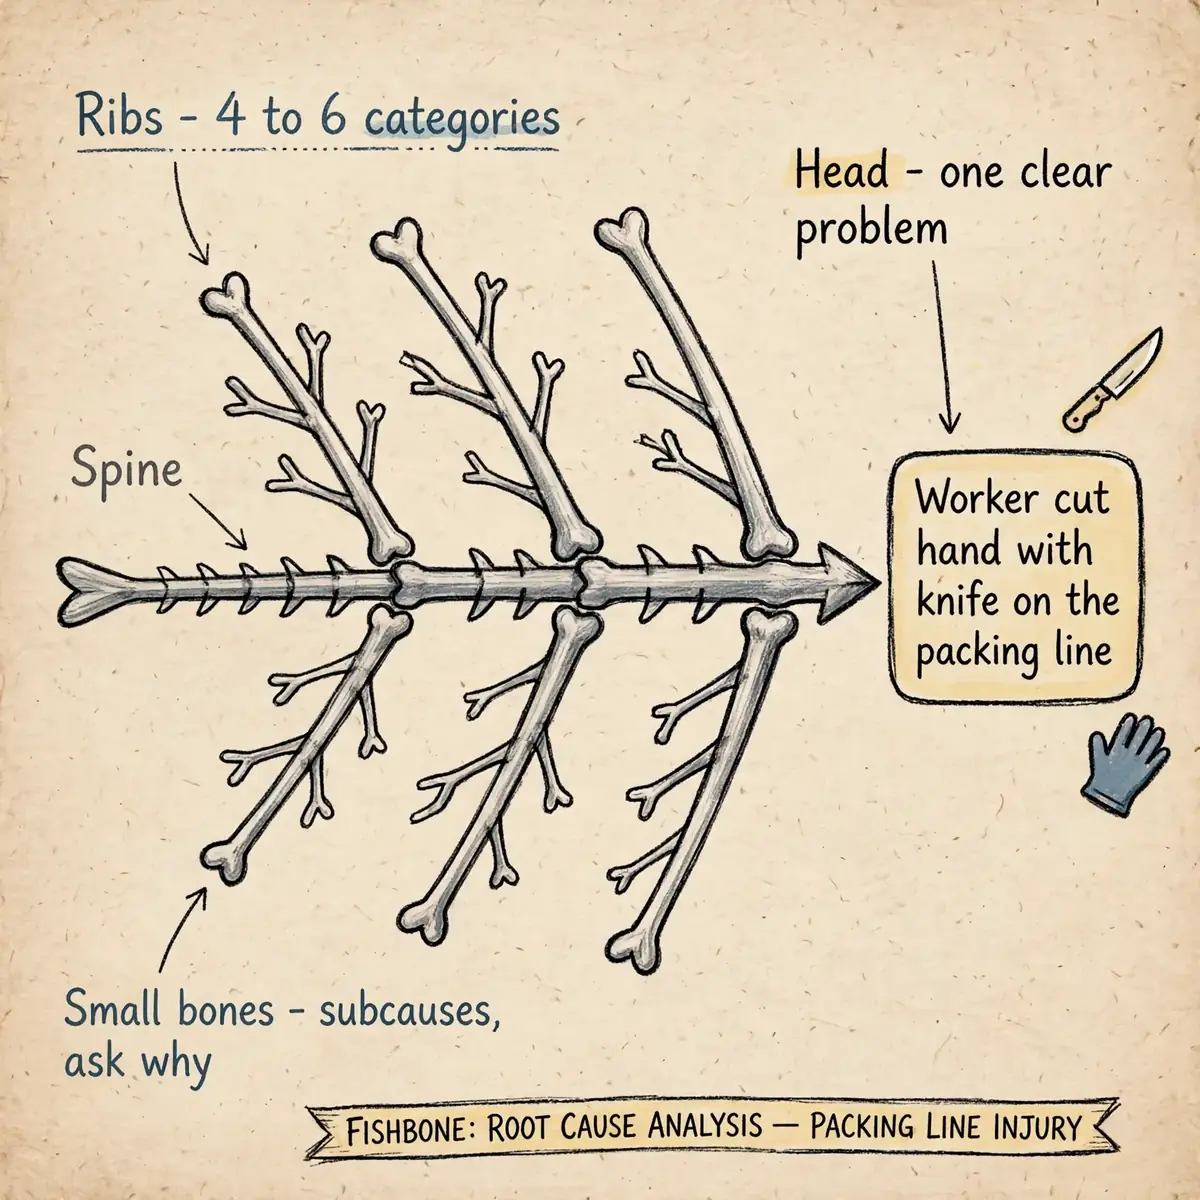
Every fishbone diagram has four parts: the head, the spine, the ribs and the small bones. Each part has a distinct job, and mixing them up is the most common way a session goes wrong.
The head: one clear problem
The head holds the problem statement, written in a box at the right-hand end of the spine. It must describe an observable, measurable effect — what happened, where, and when it started — not a judgement about who caused it. "Worker cut hand with knife on the packing line" is a problem statement. "Worker was careless" is a verdict, and it ends the investigation before it starts.
Agree the wording with the whole team before drawing anything else. A strong statement answers three questions: what is happening, where is it happening, and when did it start? If the team cannot agree on the statement, the problem itself is still unclear, and no diagram will fix that.
The spine and the ribs
The spine is a horizontal arrow running across the page toward the head. The ribs are the major cause categories, drawn as lines angling off the spine. Most diagrams use four to six ribs. Fewer than four may miss whole areas of causes; more than eight becomes hard to read.
A cause can belong under more than one rib. A calibration fault, for example, can sit under Methods and under Measurement. Write it in both places. Seeing the same cause from two angles often reveals something the first angle missed.
The small bones: subcauses
Small bones branch off each cause. They answer the question "why does this happen?" for the cause above them, and they can branch again. Layers of small bones show how deep a causal chain runs: a dull knife leads to a missed maintenance check, which leads to no maintenance schedule, which leads to nobody owning the schedule.
Keep asking why until the chain reaches something the organisation can correct. The Minnesota Department of Health gives a useful stop rule: when a cause is controlled by more than one level of management, remove it from the group. That cause belongs to a wider decision, not to this session.
Fishbone diagram categories
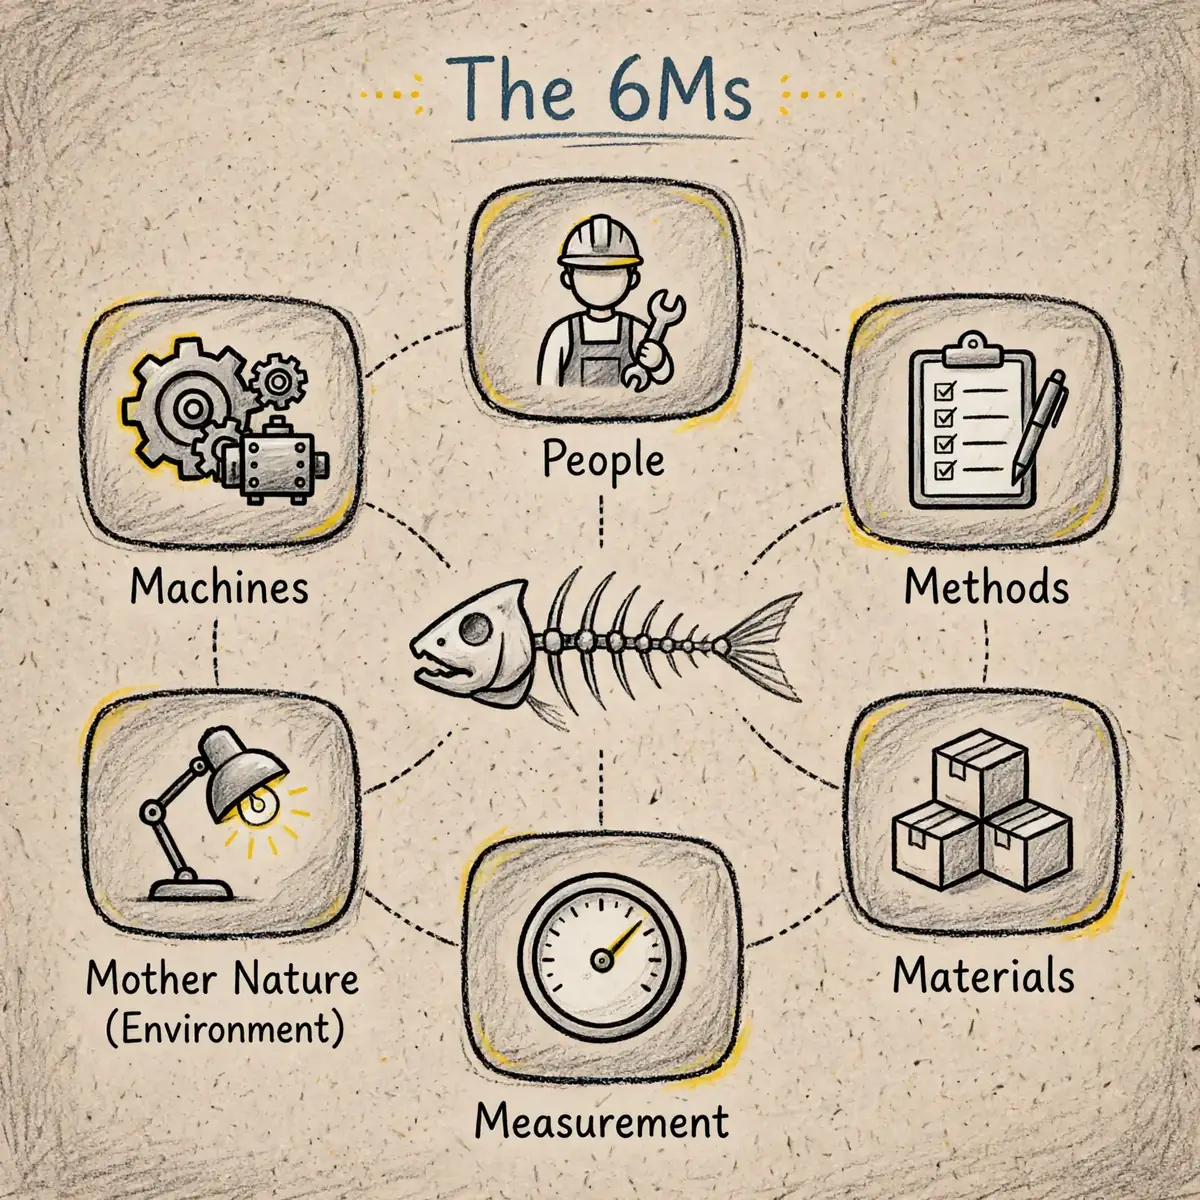
Categories are prompts, not a cage. They exist to push the team to think from different angles, so no area of causes is missed. If a cause fits nowhere, add a category rather than forcing the cause into the wrong one.
The 6Ms
Ishikawa introduced the 6Ms as generic labels for the main categories, and encouraged teams to rename them when clearer words fit their work. The six are people, methods, materials, machines, measurement and environment. A seventh M, money, is sometimes added for budget and investment causes.
| Category | What it covers | Safety example |
|---|---|---|
| People (Manpower) | Training, skills, fatigue, supervision | No task instruction given for the cutting job |
| Methods | Procedures, work instructions, rules | No written cutting procedure on the line |
| Materials | Parts, substances, supplies | Wrong knife supplied for the material being cut |
| Machines | Equipment, tools, software | Knife guard damaged and never replaced |
| Measurement | Gauges, records, inspection data | No record of recent knife inspections |
| Mother Nature (Environment) | Lighting, noise, weather, housekeeping | Poor lighting over the cutting bench |
The 6Ms work well for manufacturing and operational problems. For a safety investigation, the wording can be adjusted: "people" instead of "manpower", "equipment" instead of "machines". The labels matter less than the coverage. Every category should be checked, even the one that looks empty.
A safety-adapted set of categories
Safety teams often use a different set: people, methods, equipment, environment, materials and management. The management rib is the important addition. It holds the system weaknesses — training programmes, maintenance systems, purchasing rules, scheduling pressure — that sit behind the surface causes on the other ribs.
That set comes from safety training practice, where the fishbone is used to separate surface causes from root causes. A dull knife is a surface cause. The absence of a knife-inspection schedule is a management cause. Only the second one, fixed, stops the next knife from going dull.
Other category sets exist for other problems. The 4Ps — policies, procedures, people and plant — suit heavily regulated work. Process steps suit a workflow problem: each step of the process becomes a rib. Custom labels suit anything else. The test is simple: do the categories help the team think broadly without missing anything?
WarningNever use "worker error" as a category. A person's action is a cause to explain, not a category to file it under. Ask why the action was possible, and keep asking until the chain reaches a system that can be fixed.
How to create a fishbone diagram
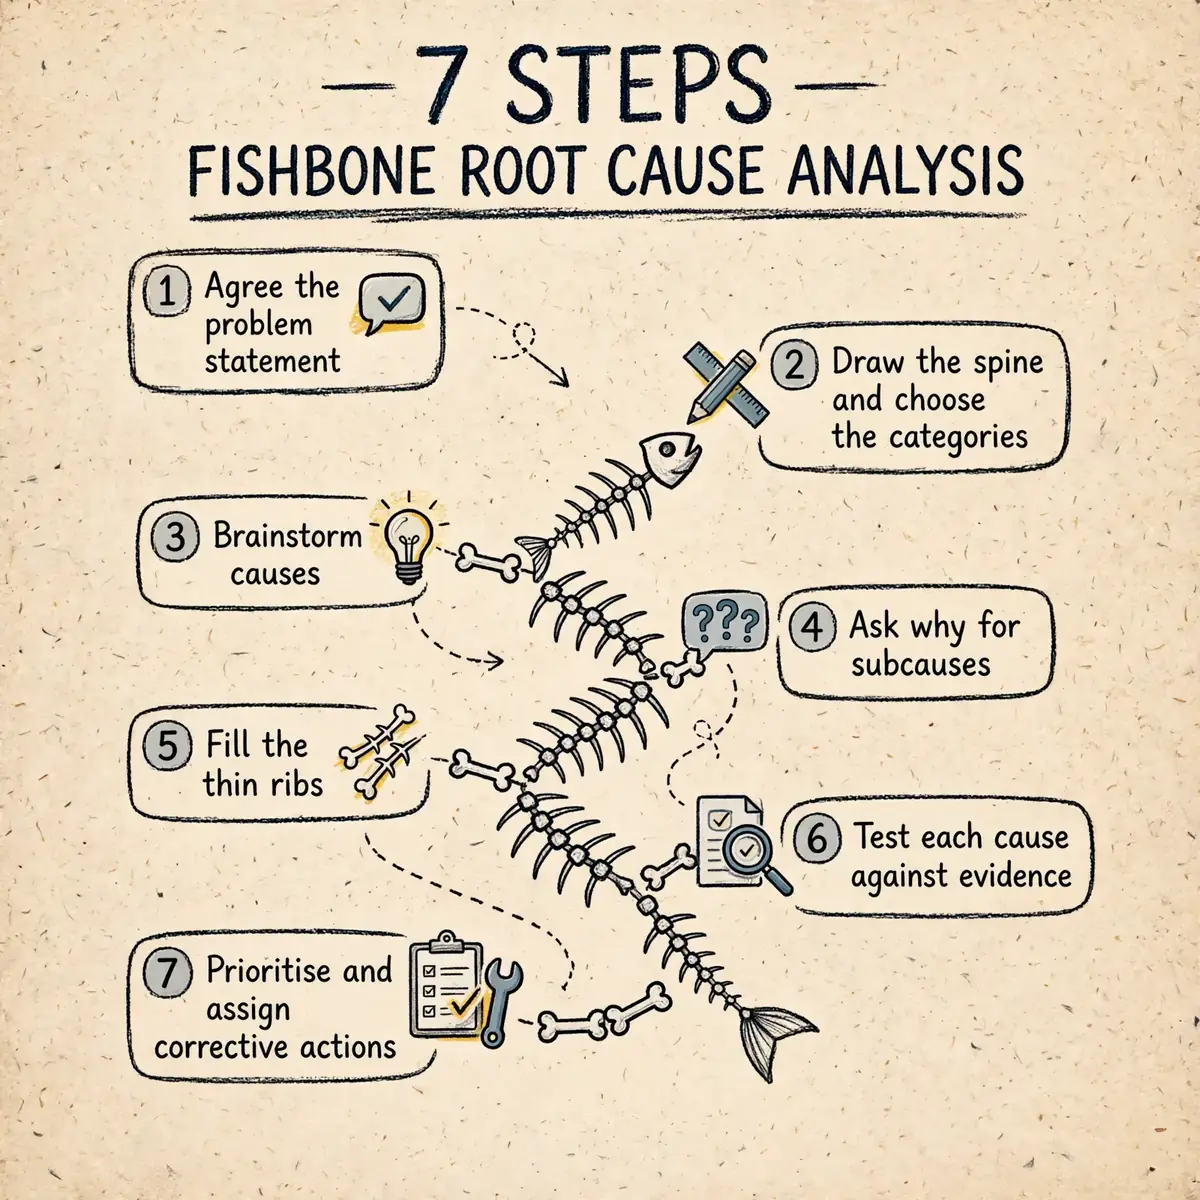
Building a fishbone diagram follows a clear process. Paper, a whiteboard or a digital whiteboard all work; the steps are the same. Allow an hour for a simple problem, and plan a second session for a serious incident, because evidence gathering takes time.
Step 1: Agree the problem statement
Start by writing the problem in the head box, on the right of the page. Make it specific: name the effect, the place and the time it started. "Hand cut by knife on packing line 2, third shift" gives the team a clear target. "Safety is poor on the line" gives them an argument.
Every person in the session must agree on the statement. If two people describe different problems, they will build two different diagrams. Settle the wording first, and write it down where everyone can see it.
Step 2: Draw the spine and choose the categories
Draw a horizontal arrow across the page toward the head box. That is the spine. Then draw the ribs: one line angling off the spine for each major category, and label each one. Use the 6Ms, the safety-adapted set, or labels of your own — whichever fits the problem.
Invite the people who do the work every day. A fishbone session needs first-hand knowledge of the process, the equipment and the routine. Managers alone will miss causes that operators see at once.
Step 3: Brainstorm causes under each category
Work through the categories one at a time and ask, for each one, "what could cause this?" Write every idea as a short phrase on the right rib. Welcome every suggestion and save the criticism for later. The aim at this stage is breadth: a cause left off the diagram cannot be tested.
- Keep each cause to a short phrase, not a sentence.
- Let the same cause appear under more than one category.
- Do not judge ideas yet — judging early shuts the session down.
- Ask the quietest people in the room; they often hold the missing cause.
Step 4: Ask why to build the subcauses
For each cause on the diagram, ask why it happens, and write the answer as a smaller branch. Then ask why again. A dull knife becomes "no maintenance checks", which becomes "no maintenance schedule", which becomes "nobody owns the schedule". Three whys are often enough; five is a manageable number for most chains.
Stop when the chain reaches something the organisation can correct — a schedule to write, a procedure to issue, a stock level to set. If the chain ends at a person, keep asking: why was the error possible, and what system failed to prevent it?
Step 5: Fill the thin ribs
When the team runs out of ideas, look at the ribs with the fewest branches. A thin rib may mean the team lacks knowledge in that area, not that nothing hides there. ASQ makes this point directly: focus on the places where there are fewer ideas.
Ask the room what is missing. Is there a measurement nobody takes? A procedure nobody has read? A supplier change nobody recorded? A thin rib is often where the root cause sits, precisely because nobody has looked there.
Step 6: Test each cause against the evidence
Now the session changes gear. Every cause on the diagram is a hypothesis, and each one must be tested against evidence before it is believed. A cause that appears in more than one category deserves a closer look. A cause that appears once, with nothing behind it, may be a guess.
Use records, measurements, photographs, maintenance logs, training files and witness accounts. Check sheets show how often a cause occurs; scatter plots test whether two things move together. Cross out causes with no support. Do not delete them — the crossed-out branches show the team did the work.
AlertA cause with no record, measurement or witness account behind it is a guess, not a finding. Cross it out until evidence supports it.
Step 7: Prioritise and assign corrective actions
Look at the causes that survived testing and ask which ones, if fixed, would stop the problem from coming back. Those are the root causes. There is usually more than one, and each one needs its own corrective action.
Give every action an owner, a deadline and a check. The check matters most: someone must confirm, after the deadline, that the problem has actually stopped. If the diagram has become messy during the session, redraw it cleanly for the record — ASQ recommends redrawing after the first version to keep the analysis clear.
The findings also feed back into the workplace safety risk assessment. A root cause found after an incident is a hazard the assessment must now control, so the assessment is updated with the new control and the next review checks whether it holds.
Worked example: a worker cuts a hand with a knife
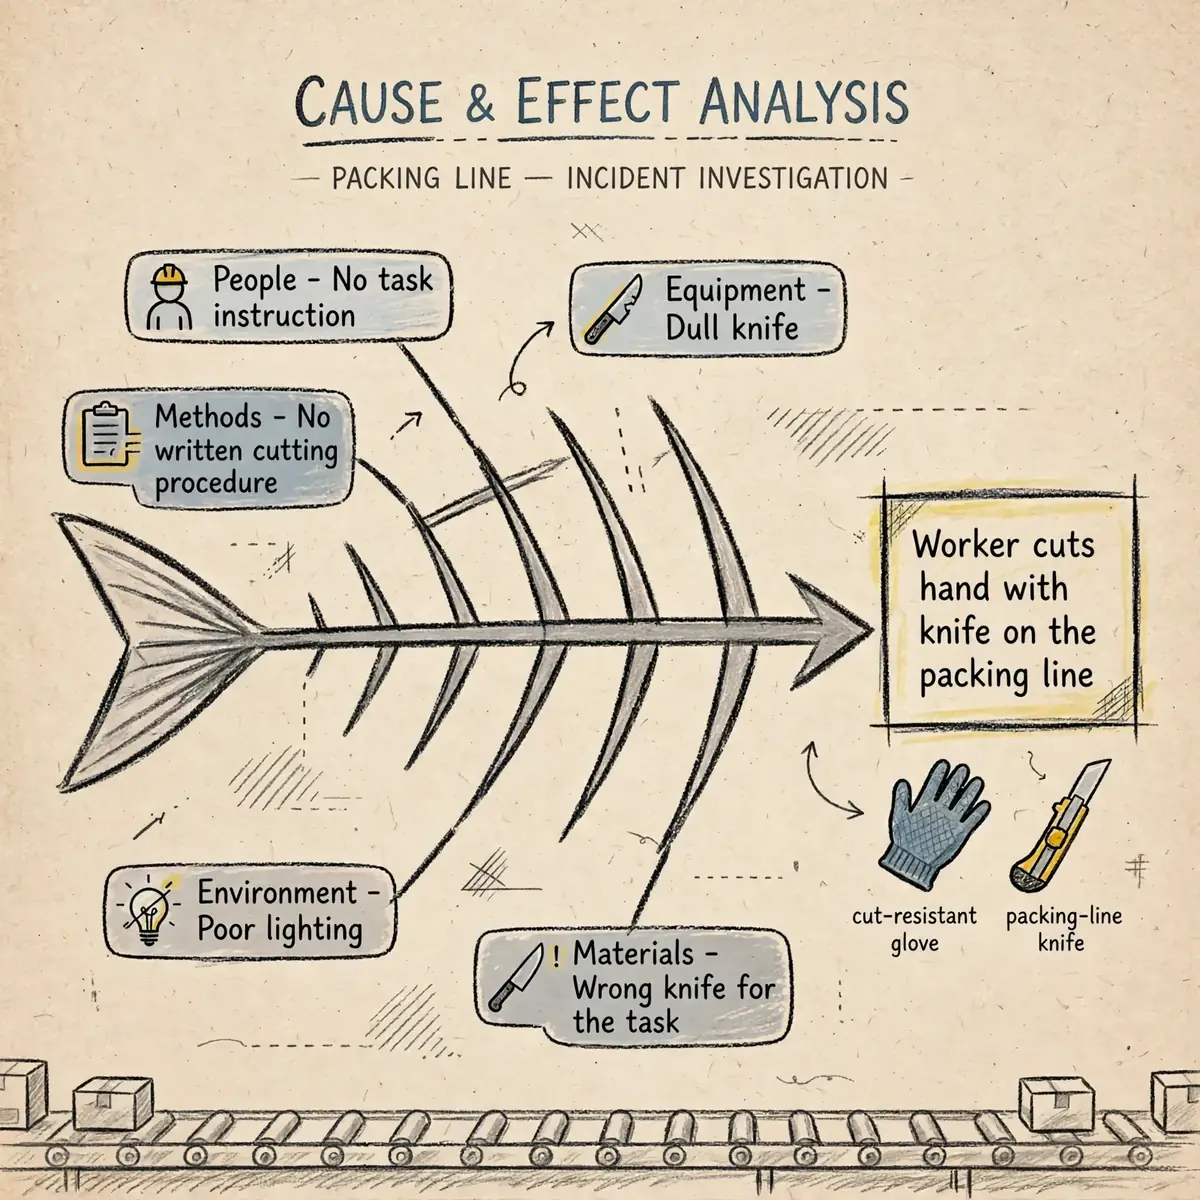
The example below is adapted from a safety-training case published by OSHAcademy, which uses it to show how surface causes and root causes separate on a fishbone diagram. It is a training illustration, not a report of a real incident, and the cause list is not exhaustive.
First aid comes first. The site's practice emergency procedures cover the immediate response, and the fishbone session starts once the person is cared for and the scene is preserved. The head of the fish holds the problem: "Worker cuts hand with knife on the packing line."
| Category | Causes found on the diagram |
|---|---|
| People | Inadequate task instruction; insufficient training; fatigue from long hours; distraction from noise |
| Methods | Improper cutting technique; no written cutting procedure; rules not enforced; rushing to meet deadlines |
| Equipment | Dull knife; no maintenance checks; no cut-resistant gloves available |
| Environment | Poor lighting over the bench; cluttered workspace; slippery floor |
| Materials | Wrong knife for the task; material difficult to cut |
Testing separates the supported causes from the guesses. The team checks the training records for a task instruction, the maintenance log for knife inspections, the rota for shift length, and the personal protective equipment (PPE) store for glove stock. A cause with a record behind it survives; "worker was distracted" has no witness account behind it, so it is crossed out.
What survives points at the safety management system, not at the worker: a training programme with no task instruction, a maintenance system with no inspection schedule, a purchasing rule that let glove stock run out, and scheduling pressure that pushed the pace. The corrective actions follow directly: issue a written cutting procedure and brief the team, set a weekly knife inspection, set a minimum glove stock level under the site's PPE requirements, and cap shift length on the line. Each action gets an owner and a deadline.
The same pattern appears in a packing-machine case shown in an incident-investigation training deck: a worker lost part of a finger while unjamming a machine, because a defective air valve left stored energy in the line, no pressure gauge showed it, and the procedure did not account for stored energy. The diagram pointed at the valve, the gauge and the procedure — not at the worker's hand.
An amputation at work must be reported to the Occupational Safety and Health Administration (OSHA) within 24 hours, which is one more reason the investigation has to find the system fault, not a person to blame.
TipUse the 5 Whys on the causes that survive testing. A fishbone diagram shows where to dig; the 5 Whys digs the hole. Together they reach the root cause faster than either tool alone.
Common mistakes that waste a fishbone session
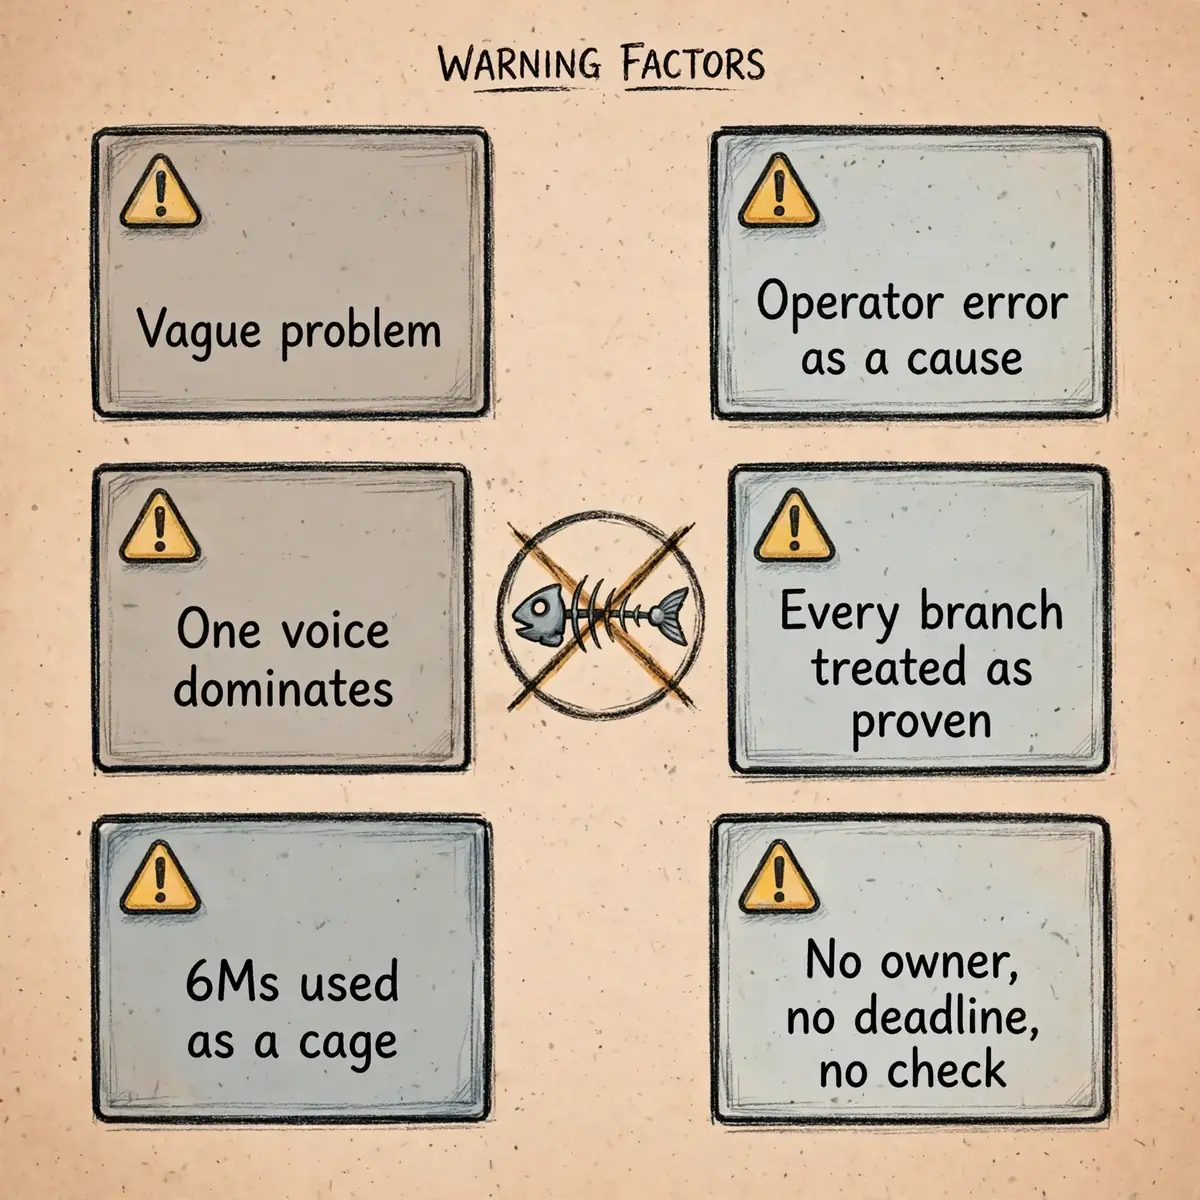
Most fishbone sessions fail in the same few ways. Knowing them in advance saves the hour.
- Starting with a vague problem, so the team argues about the problem instead of its causes.
- Writing "operator error" on a bone and stopping there, with no system cause behind it.
- Letting one voice dominate the brainstorm while the people who do the work stay silent.
- Treating every branch as proven before any evidence has been checked.
- Using the 6Ms as a cage instead of adapting the categories to the problem.
- Filing the diagram away with no owner, no deadline and no check that the fix worked.
The deepest mistake is treating the diagram as the answer. A fishbone diagram is a map of where to look. The investigation happens after it is drawn, in the records, the measurements and the interviews. A team that stops at the diagram has drawn a picture of its opinions.
Blame is the other failure to watch for. Conclusions such as "the employee was careless" or "the employee did not follow the procedure" do not identify a root cause. They stop the digging at the person, and the system fault that made the error possible stays in place for the next shift.
Fishbone diagram template and session checklist
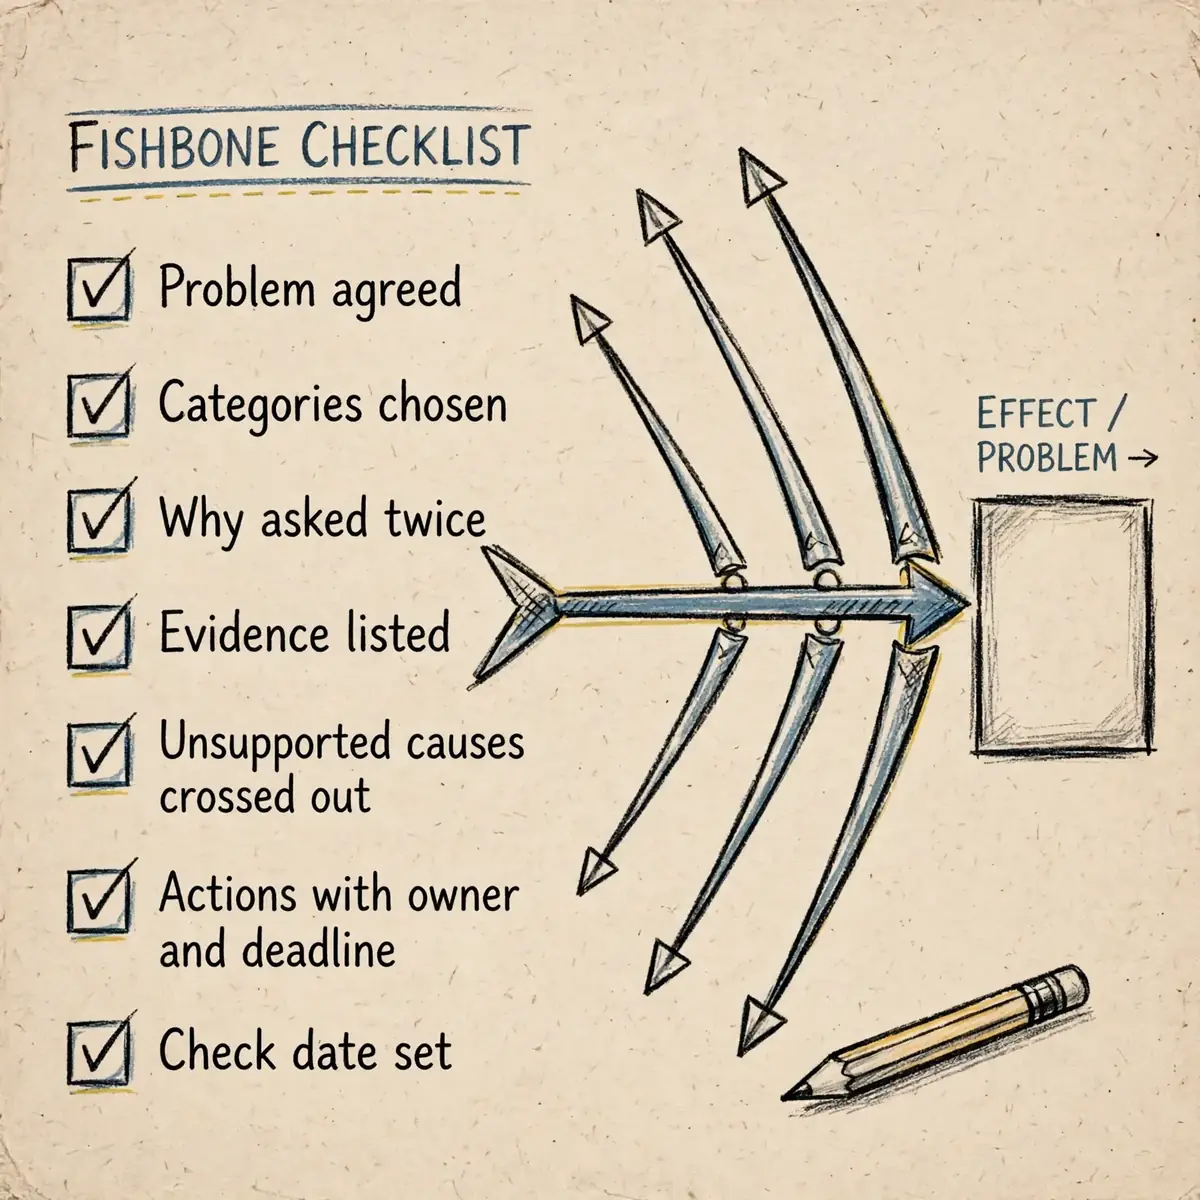
A blank fishbone diagram needs only four elements: a head box on the right holding the problem statement, a horizontal spine running to it, four to six ribs labelled with the chosen categories, and room under each rib for causes and subcauses. Copy that layout onto a whiteboard or a large sheet of paper and the session can start in minutes.
Digital whiteboards and diagram tools let a remote team build the same diagram together, attach notes to branches, and keep the finished version as part of the investigation record.
Use this checklist to run the session:
- Problem statement agreed and written in the head box.
- Categories chosen for this problem, not copied blindly from a template.
- People with first-hand knowledge of the work in the room.
- Every cause written as a short phrase on the right rib.
- "Why" asked at least twice for each main cause.
- Evidence listed beside each surviving cause.
- Unsupported causes crossed out, not deleted.
- Root causes agreed, each with an action, an owner and a deadline.
- A date set to check whether the problem has stopped.
Keep the finished diagram with the investigation record. When the same problem returns, the old diagram shows what was already tested and ruled out, so the next session starts further forward.
Frequently Asked Questions
What is the difference between a fishbone diagram and the 5 Whys?
The 5 Whys follows one chain of causes by asking why repeatedly. A fishbone diagram maps many possible causes across categories before any chain is followed. The two are often used together: the diagram shows where to dig, and the 5 Whys digs down each branch.
How many categories should a fishbone diagram have?
There is no fixed number. Four to six is typical. Fewer than four may miss whole areas of causes, and more than eight makes the diagram hard to read. The 6Ms are a common starting point, and safety teams often use people, methods, equipment, environment, materials and management instead.
What are the 6Ms in a fishbone diagram?
The 6Ms are people (manpower), methods, materials, machines, measurement and mother nature (environment). Ishikawa introduced them as generic labels, and a seventh M, money, is sometimes added. Teams are free to rename them when clearer words fit the problem.
Can a fishbone diagram prove the root cause?
No. A fishbone diagram organises possible causes so they can be tested. Evidence proves a cause: records, measurements, photographs and witness accounts. Check sheets show how often a cause occurs, and scatter plots test whether two things move together. Causes with no evidence are crossed out.
Who should be in a fishbone session?
The people who do the work every day, their supervisor, and anyone who maintains the equipment or writes the procedures. First-hand knowledge matters more than seniority. A session run by managers alone misses causes that operators see at once.
How long does a fishbone session take?
A simple problem can be mapped in about an hour. A serious incident takes longer, because the evidence has to be gathered between sessions: records checked, equipment inspected, witnesses interviewed. The diagram itself is the quick part; testing the causes is the slow part.
What do you do after the diagram is finished?
Test each cause against evidence, pick the root causes whose fix would stop the problem coming back, and give each one a corrective action with an owner and a deadline. Then check, after the deadline, that the problem has actually stopped. Without that check, the investigation is not finished.
Sources
- American Society for Quality — What is a Fishbone Diagram? Ishikawa Cause & Effect Diagram
- Minnesota Department of Health — Fishbone Diagram (Public Health Quality Improvement Toolbox)
- OSHAcademy — The "Fishbone" Cause-Effect Diagram (Course 716, Safety Management System Evaluation)
- OSHAcademy — Example of a Fish-Bone Diagram: Worker Cuts Hand with Knife (Course 716)
- Fisher Phillips — Conducting an Effective Incident Investigation (MTM OSP/NSP Safety Conference, 2023)
- MindMeister — Fishbone Diagram Example: Root Cause Analysis with the 6M Method